OpenTelemetry from 0 to 100
This is the (long) story of how we adopted OpenTelemetry at the Norwegian Labour and Welfare Administration (NAV). We will cover the journey from the first commits to real traces in production. We will also share some of the challenges we faced along the way and how we overcame them.
At NAV, we have a microservices architecture with thousands of services running in our Kubernetes clusters. We have been telling our teams to adopt Prometheus metrics and Grafana from early on, but to a large degree they still rely on digging through application logs in Kibana.
Without proper request tracing, it is hard to get a good overview of how requests flow through a system. This makes it hard to troubleshoot errors in long and often complex value chains or optimize slow requests. This was a particular challenge for our teams that have adopted an event-driven architecture with Kafka. It is like trying to navigate a city without a map.
There has been several attempts to shoehorn some form of request tracing using HTTP headers over the years. I have found Nav-Callid, nav-call-id, callId, X-Correlation-ID, x_correlationId, correlationId, x_correlation-id, and even x_korrelasjonsId (Norwegian for correlationId). There are probably even more variations out there in the wild as I only had so much time for digging around.

It seams we are stuck in an endless loop of trying to get everyone to agree on a standard, and then trying to get everyone to implement it correctly… This is where OpenTelemetry comes in! It provides a standard way to define telemetry data from your applications, and it provides libraries and SDKs for all common programming languages (there are even initiatives to make OpenTelemetry available on mainframes) to make it easy to implement. Maybe there is still hope for us!
The first steps
Even though OpenTelemetry does a lot of the heavy lifting for you, it is still a complex system with many moving parts. Did you know that OpenTelemetry is the fastest growing project in the Cloud Native Computing Foundation (CNCF)? It has an even steeper adoption curve than Kubernetes had back in the early days!
In order to get started with OpenTelemetry, you need two things:
- A place to store (and visualize) the telemetry data
- Convincing your developers that it is worth their time to instrument their applications
Doesn’t sound too hard, right? Let’s start with the storage backend.
OpenTelemetry is a vendor-neutral project, so you can choose any storage backend you like. The most popular choices are Jaeger, Zipkin, and Tempo. We chose Grafana Tempo because it is a scalable, cost-effective, and open source solution that integrates seamlessly with Grafana that we already use for metrics and dashboards.
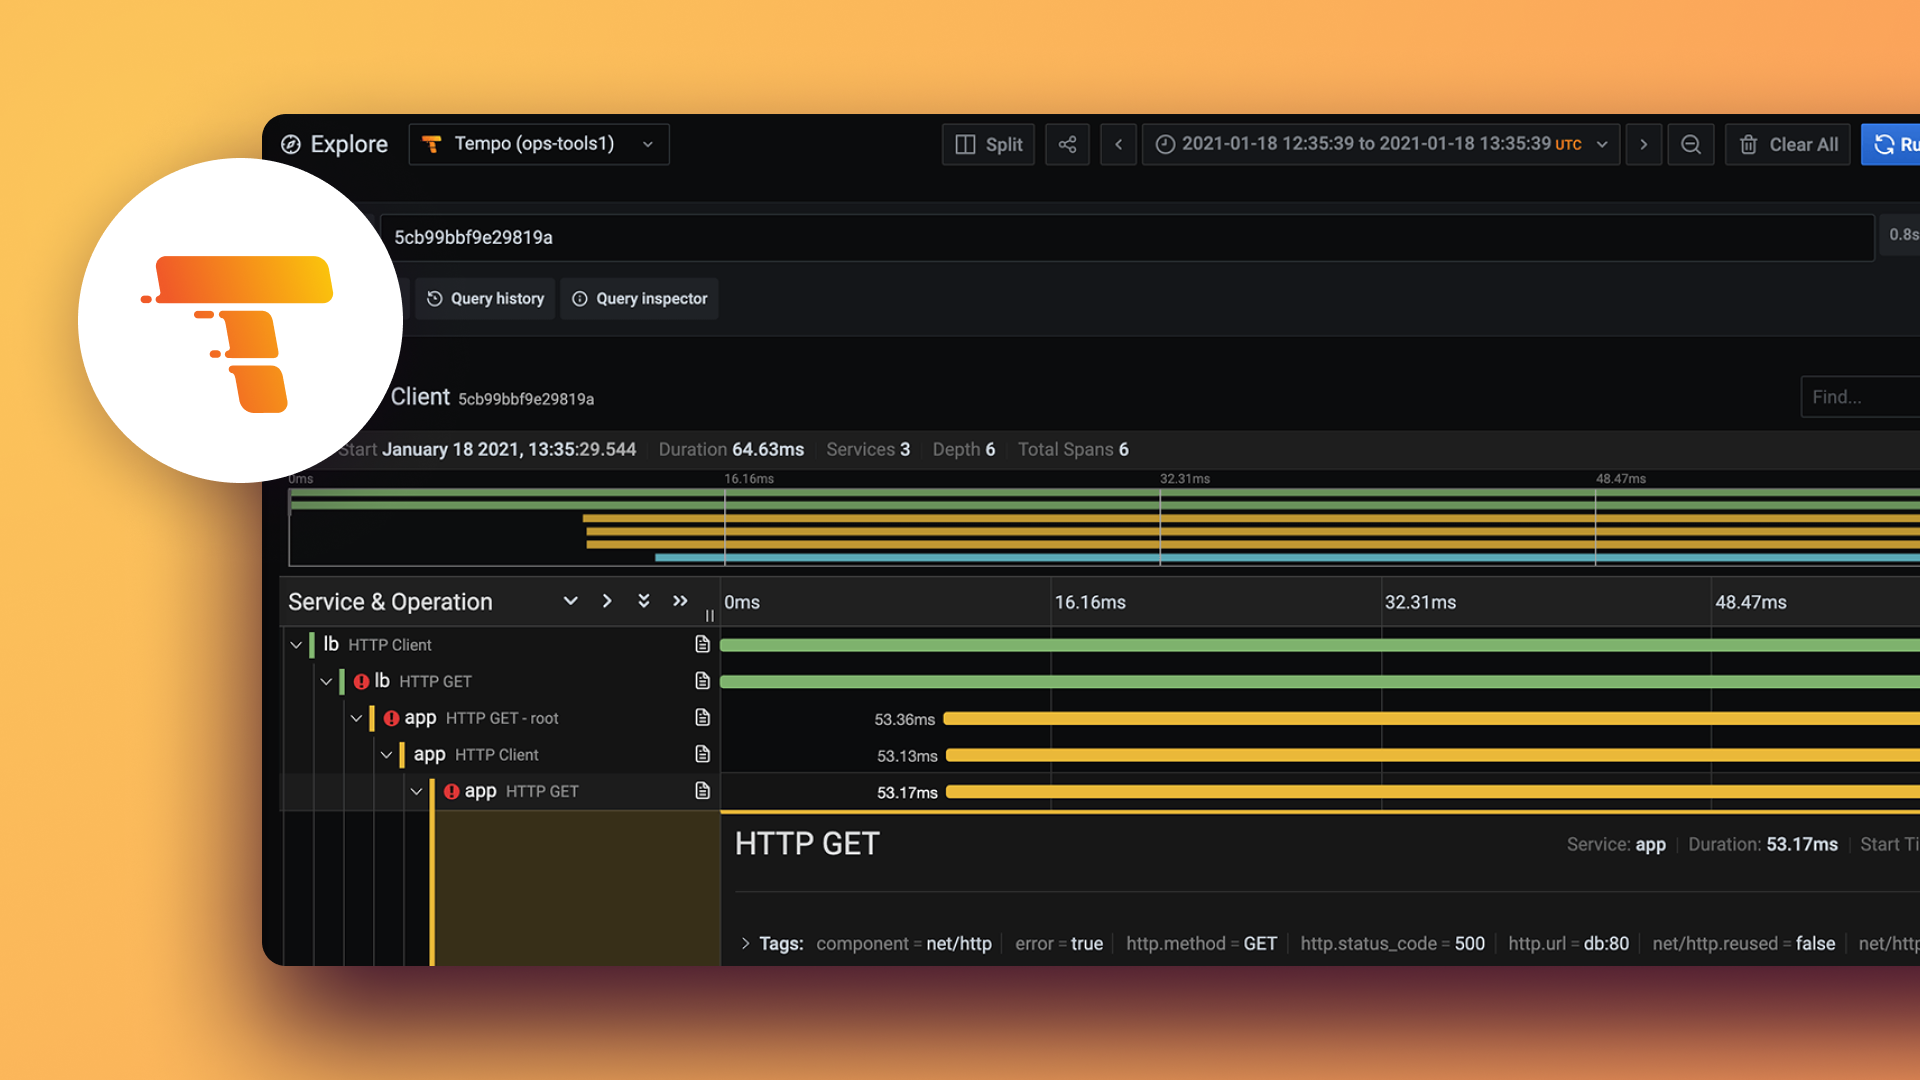
We have written extensively about how to get started with Grafana Tempo in our documentation as well as a reference guide for the query language used in Tempo called TraceQL.
You can send OpenTelemetry data directly to Tempo, but the recommended way is to use an OpenTelemetry Collector. The Collector can receive data from multiple sources, process it, and send it to multiple destinations. This makes it easy to add new sources or destinations without changing your application configuration.

Installing things like this in a Kubernetes cluster is something the NAIS team have done for the better part of ten years, so we had no problem setting up the Collector and connecting it to Tempo in our clusters. We run one Tempo instance for each environment (dev and prod) accessible from a global Grafana instance.
The hard part would be to get the developers to instrument their applications…
Instrumenting the applications
From the very beginning, we knew that the key to success was to make the developers understand the value and benefit of good observability and make it as easy as possible for the developers to instrument their applications. With over 1.600 applications in production, we couldn’t afford to spend weeks or months on each one. A solution that required manual configuration for each application was a non-starter.
With most of our backend services written in Kotlin and Java, we started by testing the OpenTelemetry Java Agent. A java agent is a small piece of software that runs alongside your application and can modify the bytecode as it is loaded into the JVM. This allows it to automatically instrument your application without any changes to the source code.
To our pleasant surprise, the agent worked out of the box with most of our applications. It was able to correctly correlate incoming and outgoing requests, understand the different frameworks we use, and even capture database queries and async calls to message queues like Kafka despite the nay-sayers who claimed this could not work as well as it was advertised. In fact, the OpenTelemetry Java agent supports over 100 different libraries and frameworks out of the box!
Previously we would have been able to install such agents on the node, but with all of our applications now running on Kubernetes that was no longer an option. We had to find a way to get the agent onto the container as there are no shared jvm runtime to hook into. In the past we have made pre-built Docker images with agents pre-installed, but this had a high maintenance cost as we had to keep the images up to date with the latest version of the agent across different base images and major versions. And not all applications are using the same base image either.
This is where the OpenTelemetry Operator comes in. This is a Kubernetes operator that can automatically inject the OpenTelemetry Java Agent (and agents for other programming languages as well) directly into your pod. It can also configure the agent to send data to the correct Collector and set up the correct service name and environment variables for each application since it has access to the Kubernetes API.
Putting it all together
In case you are new to NAV, we have a open source application platform called nais that provides everything our application teams need to develop, run and operate their applications. It’s main component is naiserator (a Kubernetes Operator) and the nais.yaml that defines how an application should run in our Kubernetes clusters.
A minimal application manifest looks something like this:
apiVersion: "nais.io/v1alpha1"
kind: "Application"
metadata:
  name: "my-application"
  namespace: "my-team"
spec:
  image: "navikt/my-application:abc123"
  replicas: 2
  ...
This is a very powerful abstraction that have allowed us to add new features to the platform with as little effort on the developer’s part as possible. We added a new field to nais.yaml called observability that allows the developers to enable tracing for their applications with only four lines of yaml configuration:
---
observability:
  autoInstrument:
    enabled: true
    runtime: "java"
When naiserator sees this field, it sets the required OpenTelemetry Operator annotations to get the correct OpenTelemetry configuration and agent according to the runtime. We currently support auto-instrumenting java, nodejs and python. This way, the developers don’t have to worry about how to set up tracing in their applications, they just have to enable it in the manifest. This is a huge win for us! 🎉
For many of our applications, this was all that was needed to get traces flowing. Developers can still add additional spans and attributes to their traces using the OpenTelemetry SDKs directly, or they can choose to disable auto-instrumentation and instrument their applications manually.
We also enabled tracing in our ingress controller so that we could see the full request path from the client to the backend service. Since we are using the Ingress Nginx controller, this was just a matter of enabling the OpenTelemetry configuration in the Helm chart to get traces for all incoming requests.
Rise and fall of adoption
We got a lot of positive feedback from the developers when we launched the auto-instrumentation feature. They were happy to see traces in Grafana and Tempo, and they could finally get a good overview of how requests flowed through their applications. We even saw a few teams that started using traces to troubleshoot errors and optimize slow requests.
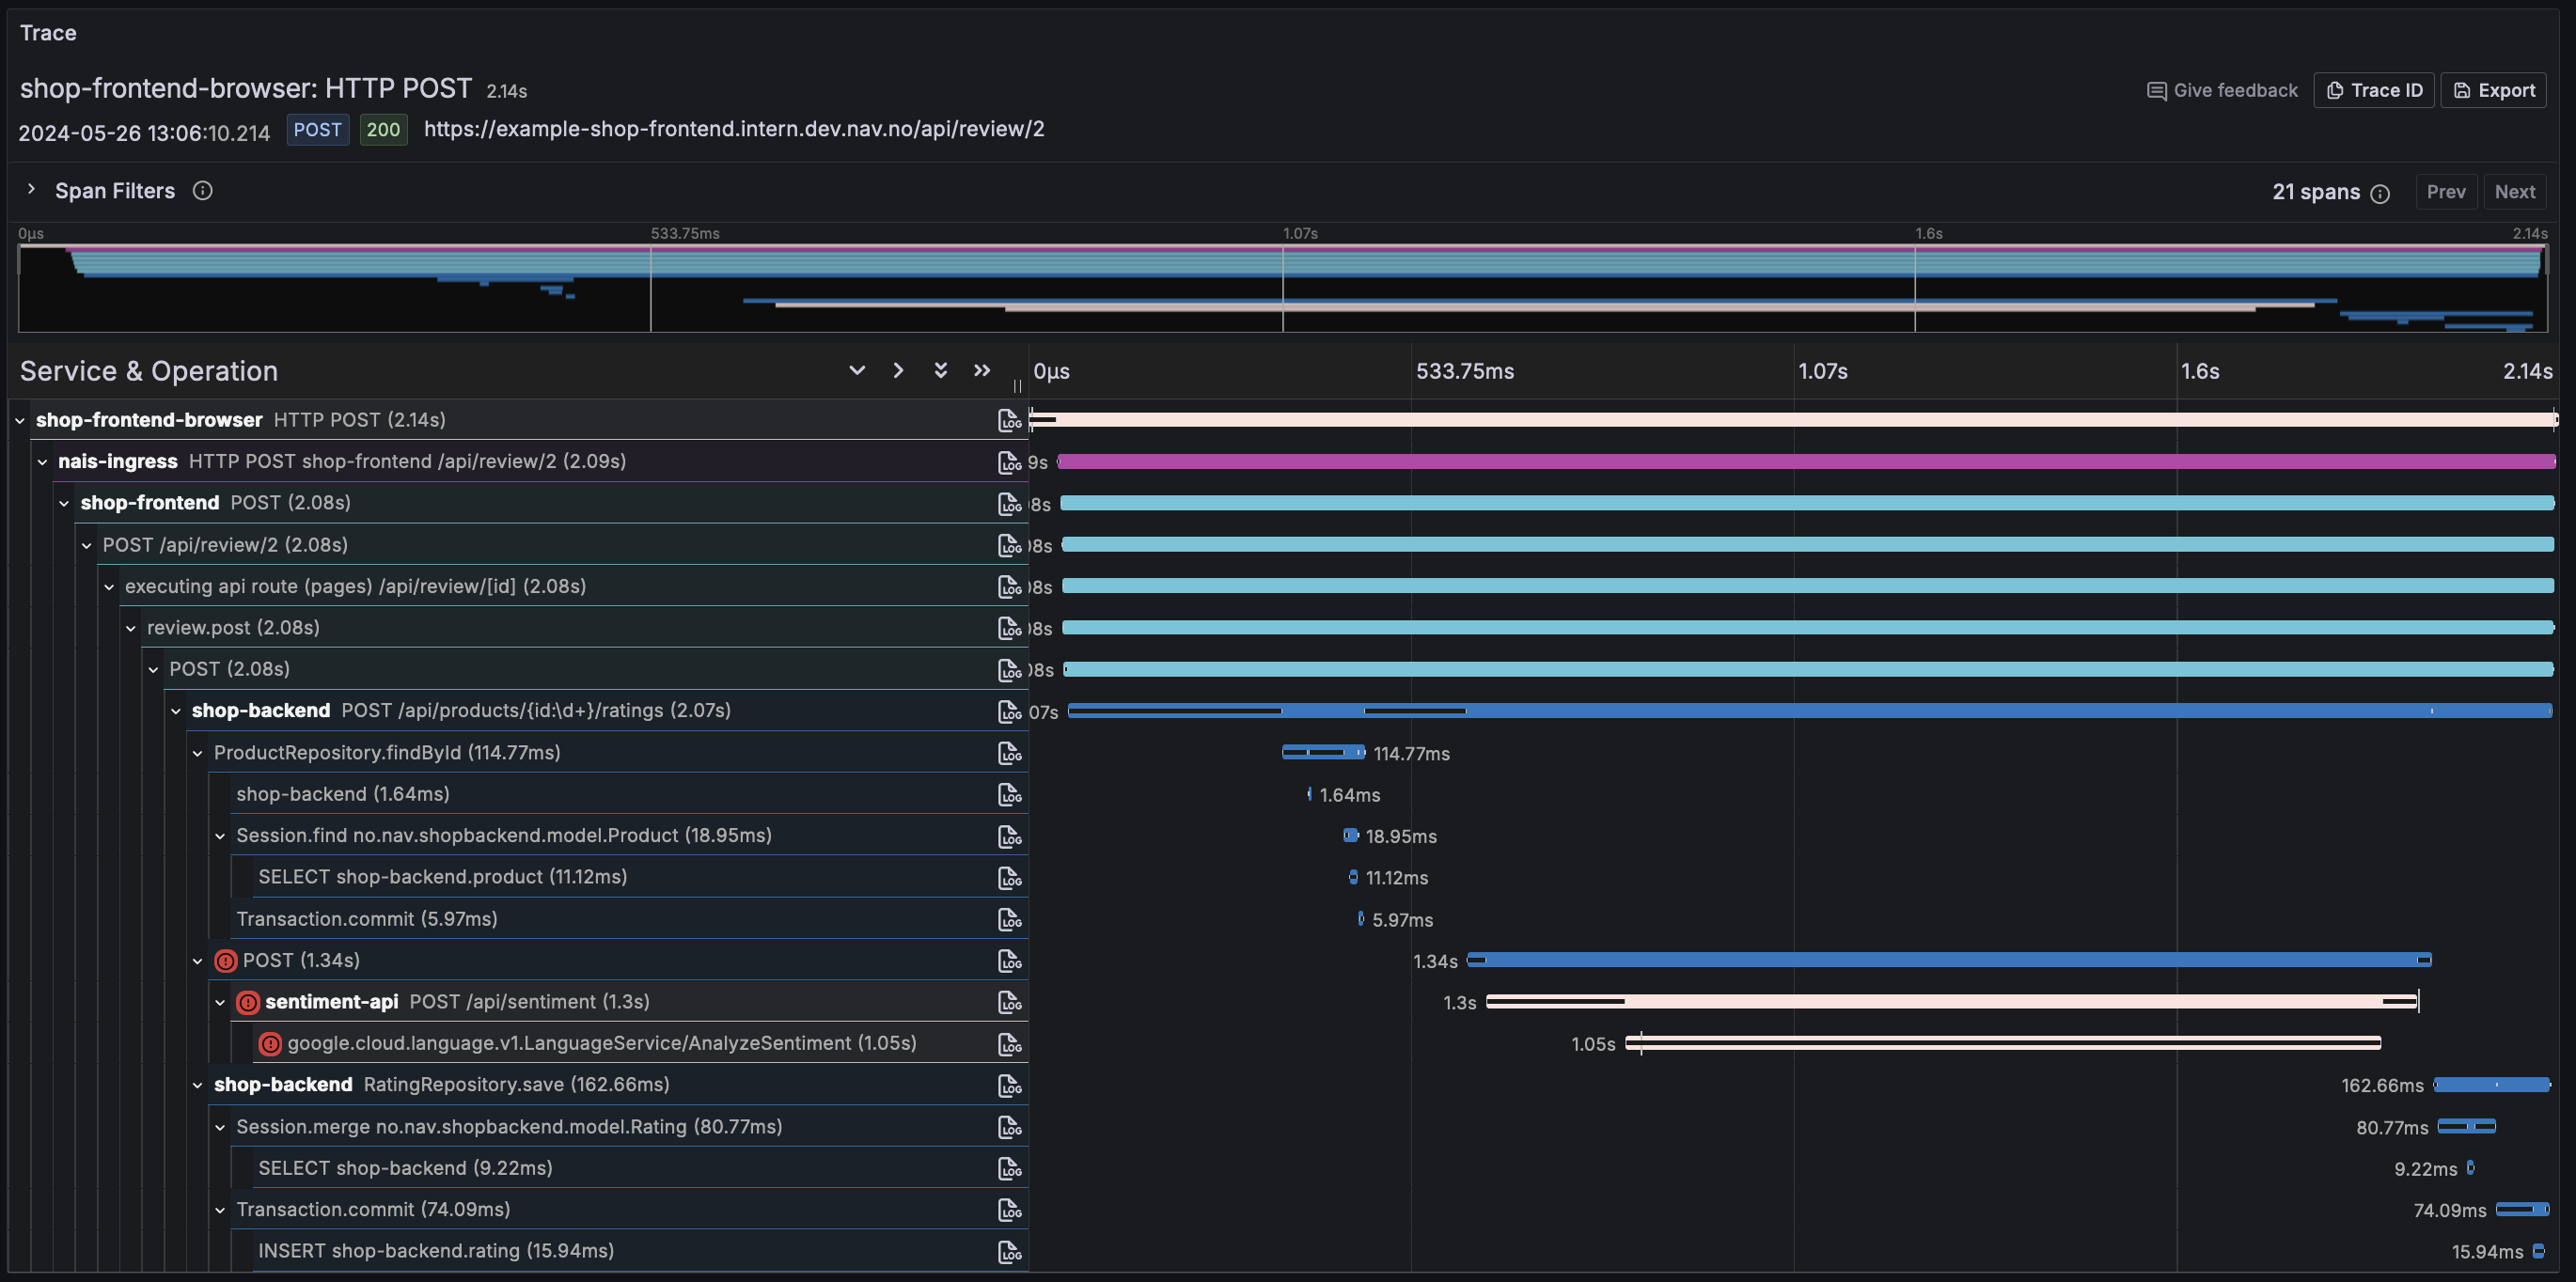
It is absolutely amazing to see the full request path from the client to the backend service in Grafana Tempo using the Grafana Faro Web SDK. This is insight that we have never had before, and it is a game changer for our developers, especially those working with frontend development.
But as time went on, we noticed that the adoption rate some times dropped. Some teams disabled tracing because it consumed more resources, others disabled it because they didn’t see the value in it. We also saw that some teams had trouble understanding the traces and how to use them effectively.
It is clear that we need to do more to educate the developers on how to use traces effectively, but more on that later.
The road to success is paved with challenges
While we have made great progress towards adopting OpenTelemetry by our applications and developers, there have been bumps along the road that we have had to overcome.
Noisy trace spans - the whack-a-mole problem
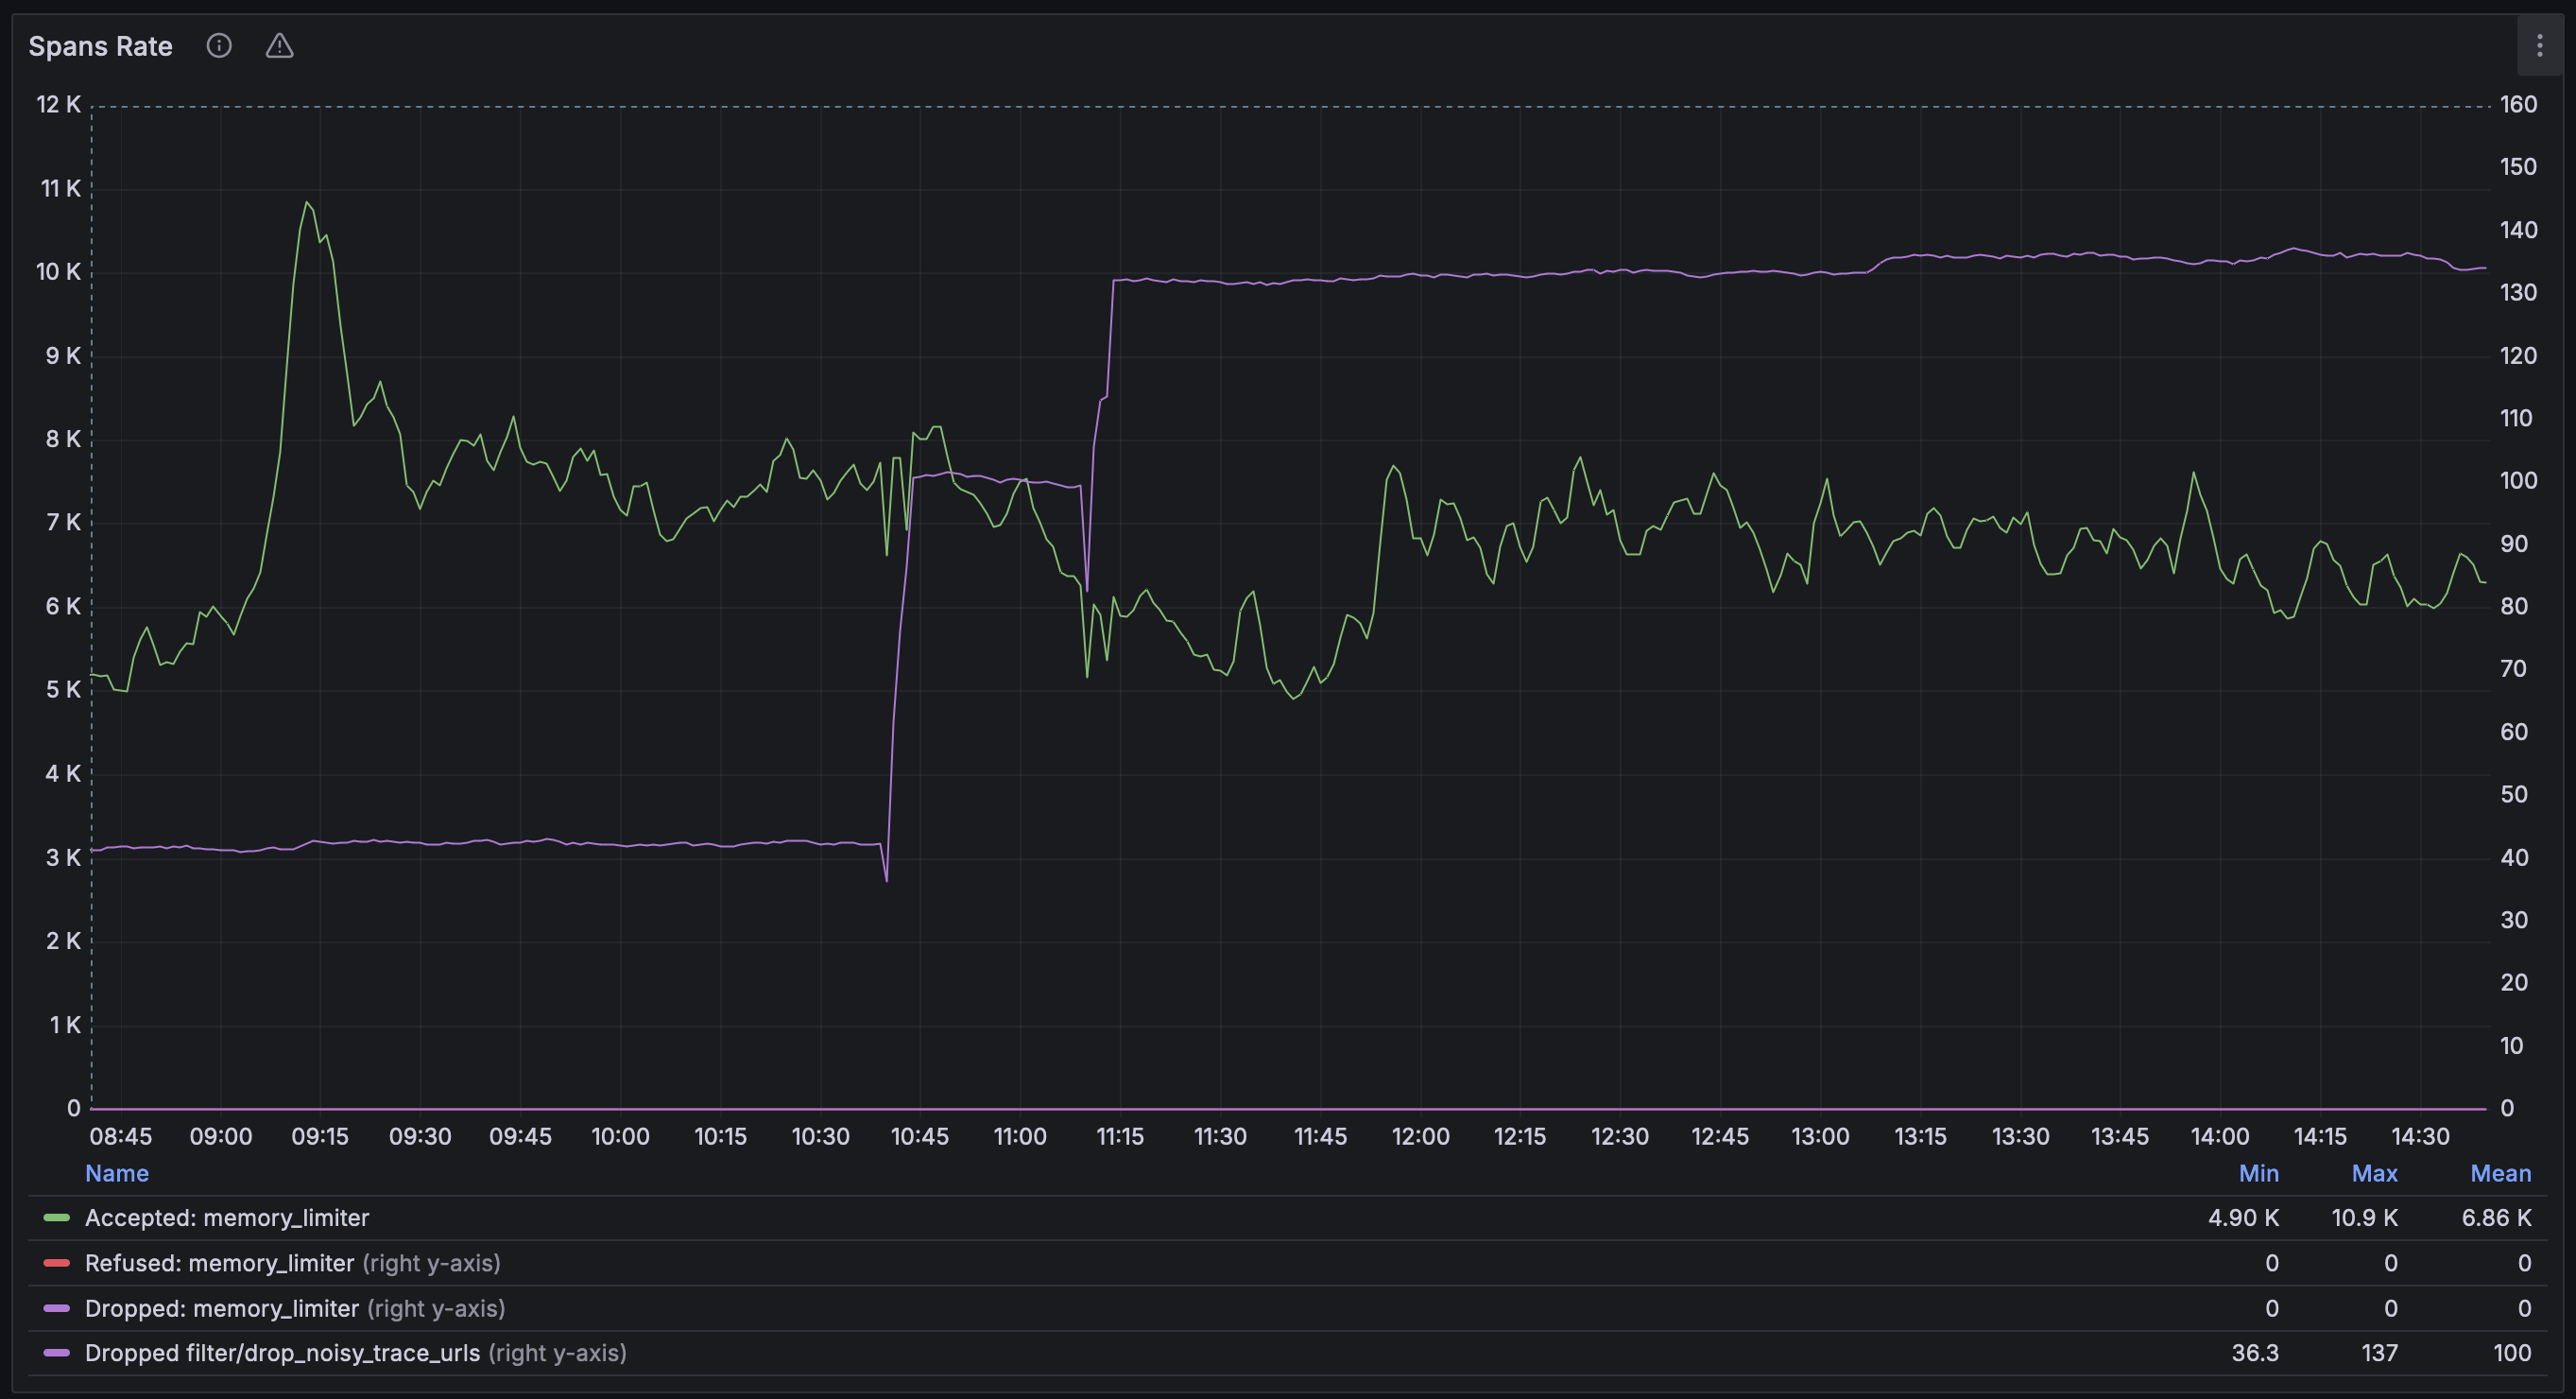
Almost immediately after we enabled tracing in our ingress controller, we started getting reports from developers that the traces overviews in Grafana were filled with noise. All requests to the application were traced, including health checks, readiness checks, and metrics scraping. This made it hard to find the traces that were interesting and relevant.
The solution was to filter out the noise. We added a filter to the OpenTelemetry Collector that would drop traces for certain paths or status codes. This reduced the noise significantly and made it easier to find the traces that were relevant.
This is a common problem as indicated by the comments in opentelemetry-java-instrumentation#1060 where multiple users have requested the ability to filter out certain spans.
While there are more advanced ways to filter out noise, like using tail sampling, we found that a simple filter was enough for our needs. The only downside is that it might leave some orphaned spans that are not part of a trace.
The filter is defined in the common OpenTelemetry Collector and we do recognize that it might not be a scalable solution in the log run. We are looking into ways to make it easier for the developers to define their own filters in the future.
filter/drop_noisy_trace_urls:
  error_mode: ignore
  traces:
    span:
      - |
        (attributes["http.method"] == "GET" or attributes["http.request.method"] == "GET") and (
          attributes["http.route"] == "/favicon.ico" or attributes["http.target"] == "/favicon.ico" or attributes["url.path"] == "/favicon.ico"
          or IsMatch(attributes["http.route"], ".*[iI]s_?[rR]eady")    or IsMatch(attributes["http.target"], ".*[iI]s_?[rR]eady")       or IsMatch(attributes["url.path"], ".*[iI]s[rR]eady")
          or IsMatch(attributes["http.route"], ".*[iI]s_?[aA]live")    or IsMatch(attributes["http.target"], ".*[iI]s_?[aA]live")       or IsMatch(attributes["url.path"], ".*[iI]s[aA]live")
          or IsMatch(attributes["http.route"], ".*prometheus")         or IsMatch(attributes["http.target"], ".*prometheus")          or IsMatch(attributes["url.path"], ".*prometheus")
          or IsMatch(attributes["http.route"], ".*metrics")            or IsMatch(attributes["http.target"], ".*metrics")             or IsMatch(attributes["url.path"], ".*metrics")
          or IsMatch(attributes["http.route"], ".*actuator.*")         or IsMatch(attributes["http.target"], ".*actuator.*")          or IsMatch(attributes["url.path"], ".*actuator.*")
          or IsMatch(attributes["http.route"], ".*internal/health.*")  or IsMatch(attributes["http.target"], ".*internal/health.*")   or IsMatch(attributes["url.path"], ".*internal/health.*")
          or IsMatch(attributes["http.route"], ".*internal/status.*")  or IsMatch(attributes["http.target"], ".*internal/status.*")   or IsMatch(attributes["url.path"], ".*internal/status.*")
        )
It is also worth mentioning that we do believe that the long term solution is to educate the developers on how to use the TraceQL query language effectively to find the traces they are interested in instead of playing whack-a-mole with noisy spans.
Rapid and Rivers - death by a thousand spans
We have embraced an event-driven architecture with Kafka as the backbone for many of our services. Some have even adopted the Rapids, Rivers and Ponds pattern by Fred George where all services will subscribe to all events and filter out the ones they are interested. This makes it hard to trace a request through the system since it can go through a seemingly endless number of services.
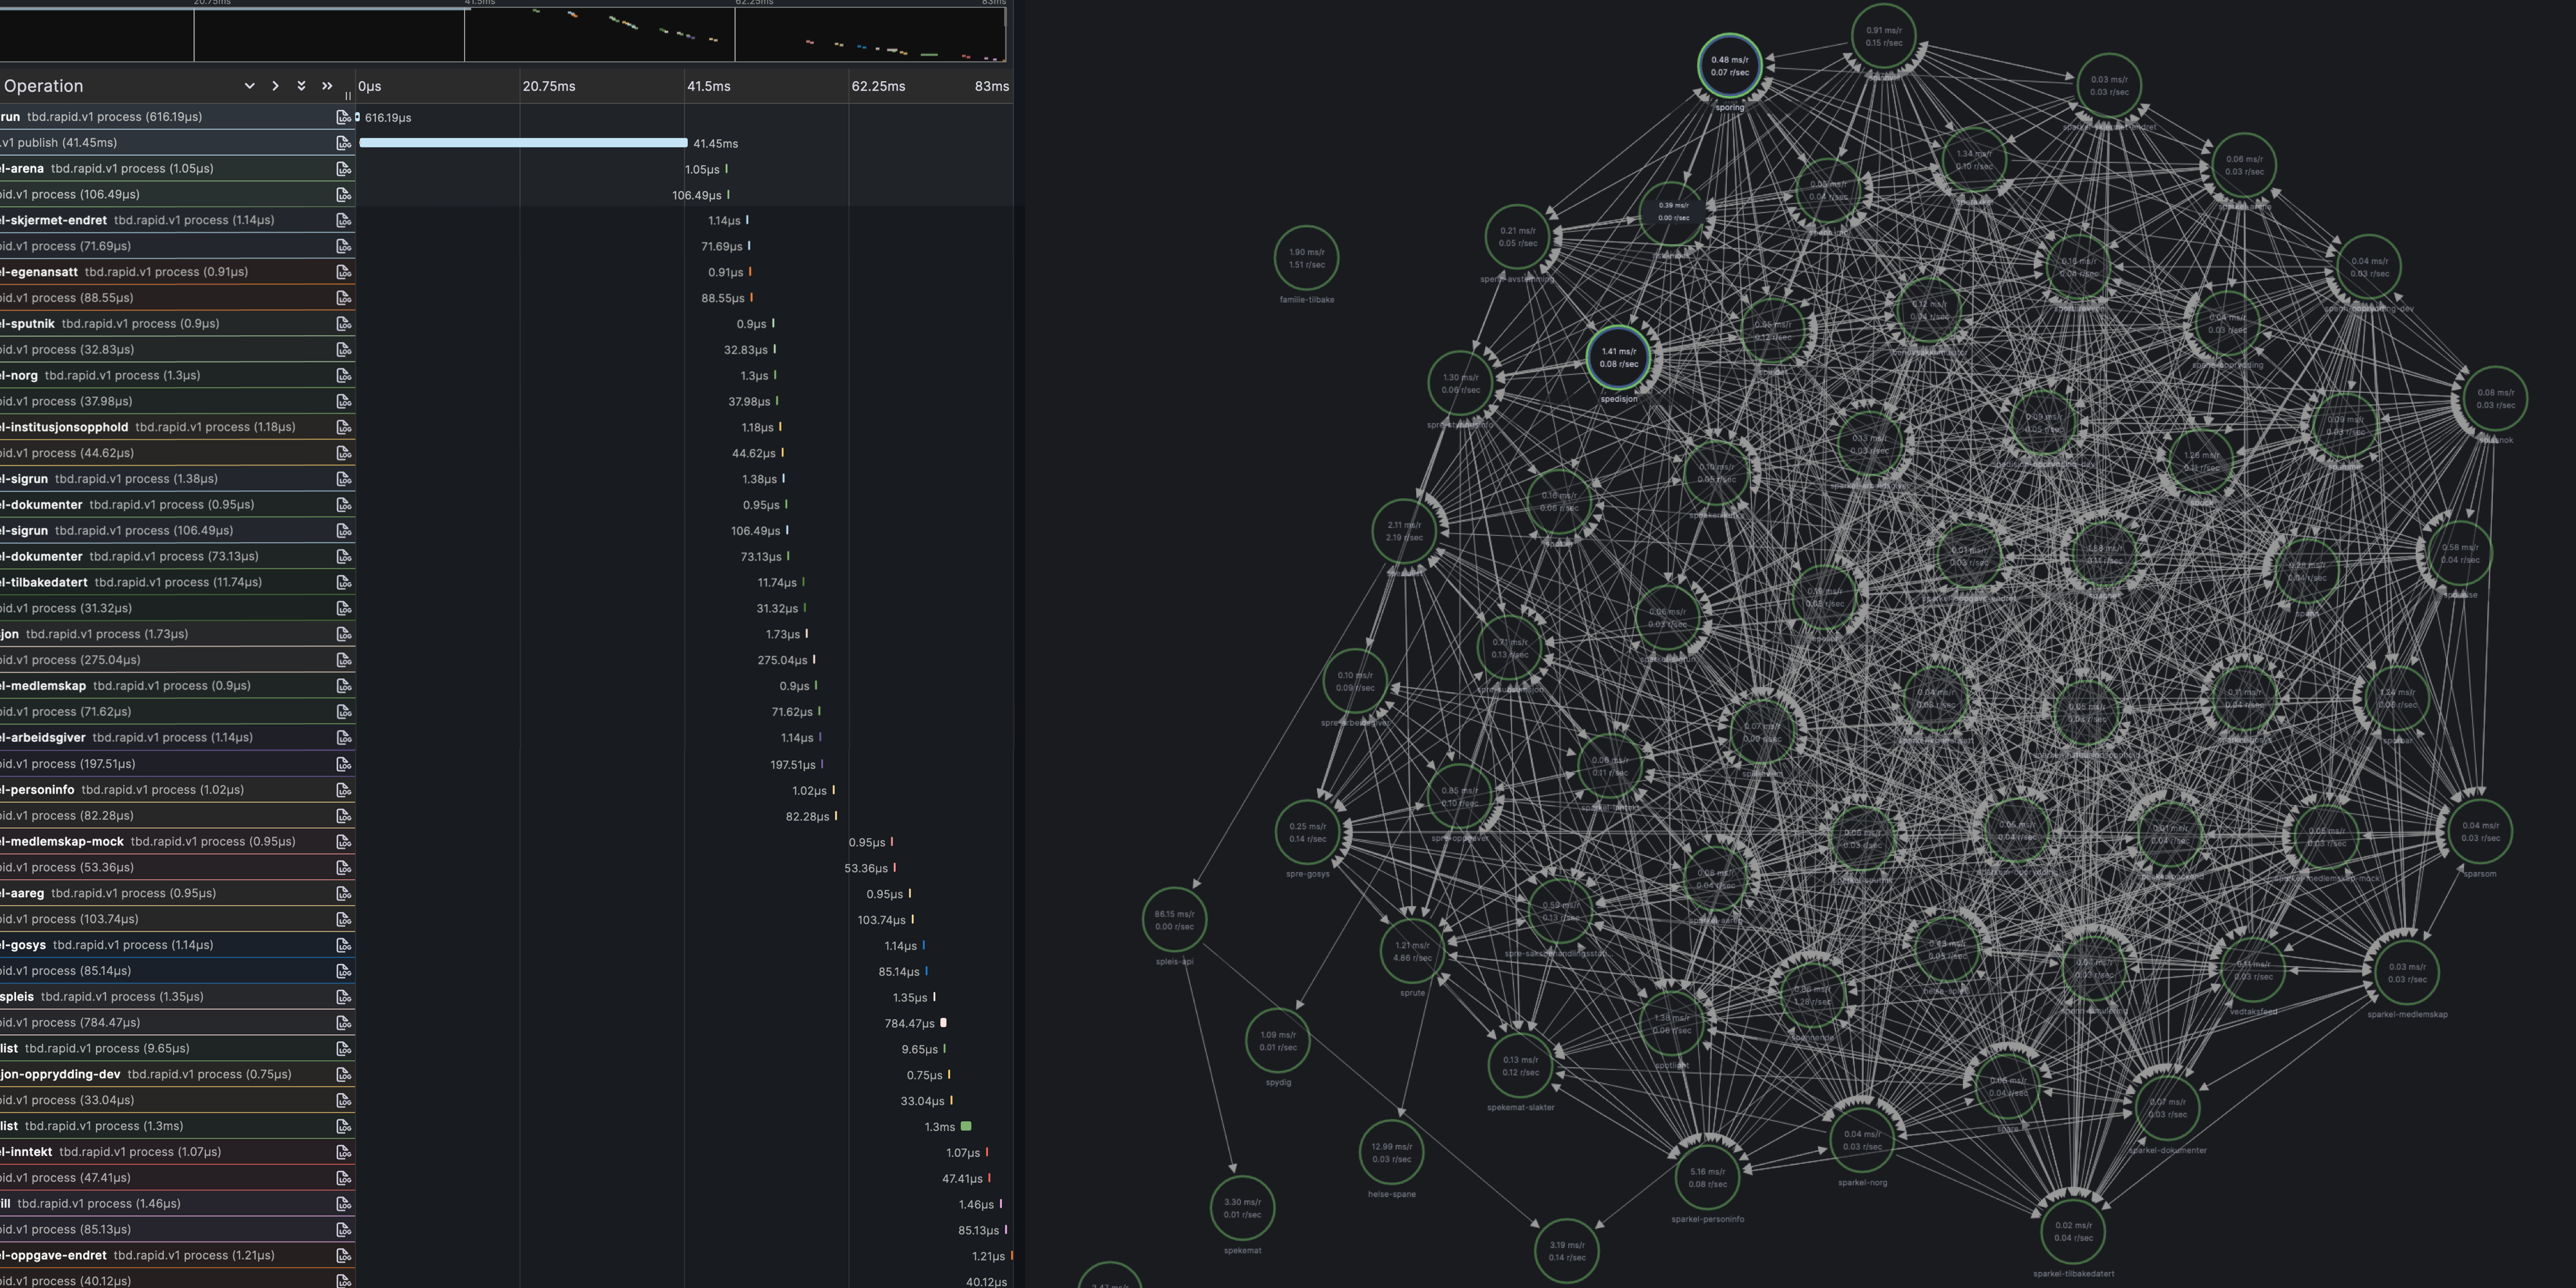
The main challenge that we have faced is that the default span trace limit in Grafana Tempo of how large a single trace can be and we have had to increase it to 40 MB to be able to see the full trace for some of our requests (and even then it is sometimes not enough). This is a problem that we are still working on solving, but it is not an easy one.
From talking with the OpenTelmetry community one possible solution might to use span links, but we are unsure how well this will work in practice, and if will be able to visualize them in Grafana Tempo in a meaningful way (ref. grafana/tempo#63531).
Node.js applications - the odd one out
While NAV is mainly a Java and Kotlin shop, we do have a few Node.js applications in production, mostly Next.js and Express.
First out, while Next.js is supposed to have OpenTelemetry support out of the box, we found that it does not appear to be working in standalone mode (ref. vercel/next.js#49897).
So we had to turn to auto-instrumentation here as well. However,due to the way we lock down our containers in Kubernetes, we got some strange errors instrumenting the application due to different ownership of the files in the container. This had to be fixed before we could continue (ref. opentelemetry-operator#2655)
Finally we got the Node.js applications up and running with OpenTelemetry, only to find out that some outgoing requests from Node.js applications were not being traced as the traceparent header was not being propagated. As a workaround we had to add the traceparent header manually to the outgoing requests like this:
const response = await fetch(someUrl, {
  headers: {
    get traceparent() {
      return getTraceparentHeader();
    },
    'Content-Type': 'application/json'
  },
  ...
});
Support for Node.js fetch was added in auto-instrumentations-node-v0.45.0 with the introduction of the @opentelemetry/instrumentation-undici package.
Unwanted logs - the sensitive information problem
One of the main advantages with the agent is correlated logs and traces. The agent understands various logging libraries such as log4j, logback, and slf4j and can automatically add trace information and send them to Grafana Loki.
We turned this feature on for all applications, unaware that the agent would intercept all log sinks, not only those targeted for stdout/stderr as some applications were logging sensitive information like social security numbers and personal information to a specific log file.
Applications must now opt-in to the log interception feature by adding the following environment variable to their deployment:
spec:
  env:
    - name: OTEL_LOGS_EXPORTER
      value: otlp
We have engaged with the OpenTelemetry community to see if there is a way to only intercept logs that are targeted for stdout/stderr, but as of now, this is the only way to disable the log interception feature.
The future of OpenTelemetry at NAV
We have come a long way in a short time with, but there is still a lot of work to be done. It is clear that OpenTelemetry is a powerful tool, but it is no silver bullet. It requires a lot of effort to get right, and it will take time to educate the developers on how to use it effectively.
Default Dashboards and Panels
A few teams have started creating custom dashboards and panels in Grafana to visualize their OpenTelemetry data, but not too many. We need to make it easier for all teams to have good quality dashboards, and we are looking into ways to provide templates and examples that teams can use to get started and customize to their needs.
This is by far the most challenging thing with Grafana, you can do anything but it does not come for free or out of the box. Maybe Library Panels in Grafana can help us with that?
Span Metrics
Span Metrics is a feature of Grafana Tempo that allows you to generates metrics from ingested tracing data, including request, error, and duration (RED) metrics. We believe that span metrics may lower the entry barrier for using exemplars. An exemplar is a specific trace representative of measurement taken in a given time interval.
Before we can enable span metrics, we need to make sure our Prometheus instance is able to handle the additional load. Maybe Grafana Mimir can help us with that?
Correlation with logs and metrics
We have seen some of the potential of correlating logs and traces, but this is not something that has been widely adopted yet. Logs is collected as stdout/stderr and metrics are scraped by Prometheus which makes it hard to correlate logs and metrics with traces since they are treated independently.
Rather, sending traces, logs, and metrics through the OpenTelemetry SDKs and the OpenTelemetry Collector would automatically correlate them and get the full benefit of what OpenTelemetry has to offer.
Training and Workshops
We have started planning training sessions and workshops for the developers to teach them how to use OpenTelemetry effectively. We have also created a documentation site with guides, tutorials, and examples that developers can use to learn more about OpenTelemetry.
Later this year we will host the first ever Public Sector Observability Day where we will invite developers from all over the Norwegian public sector to learn more about observability and how to use OpenTelemetry effectively.
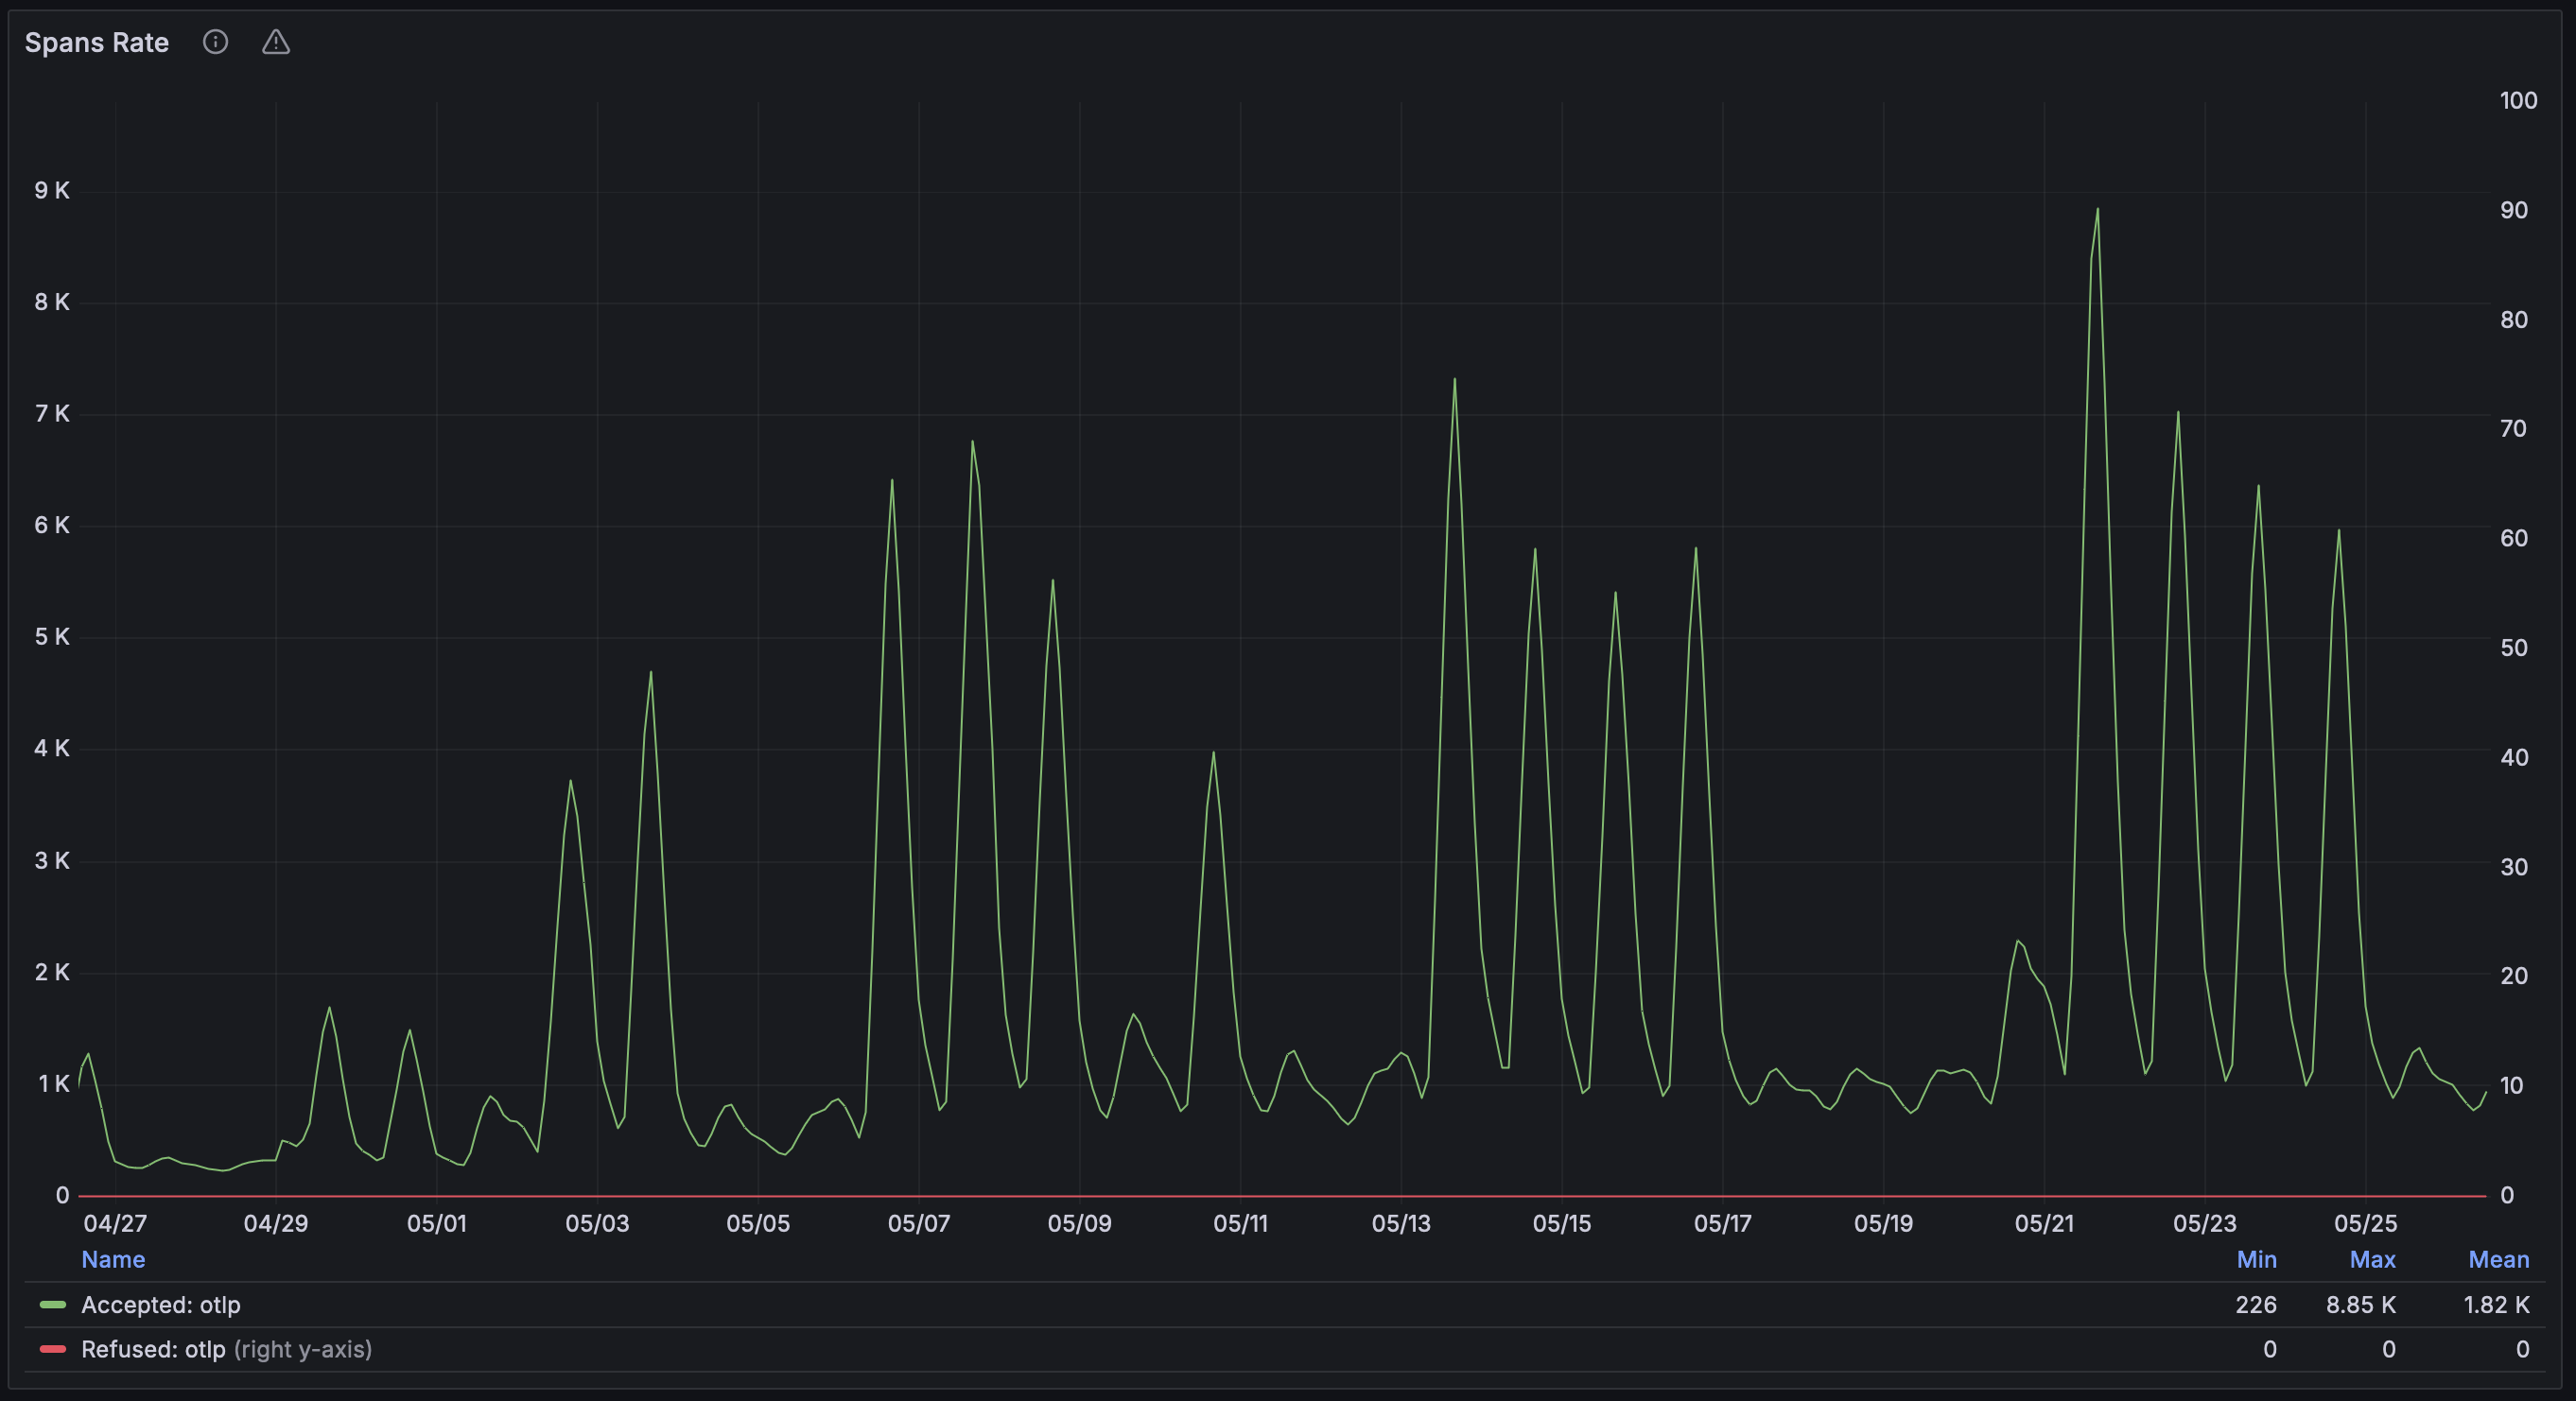
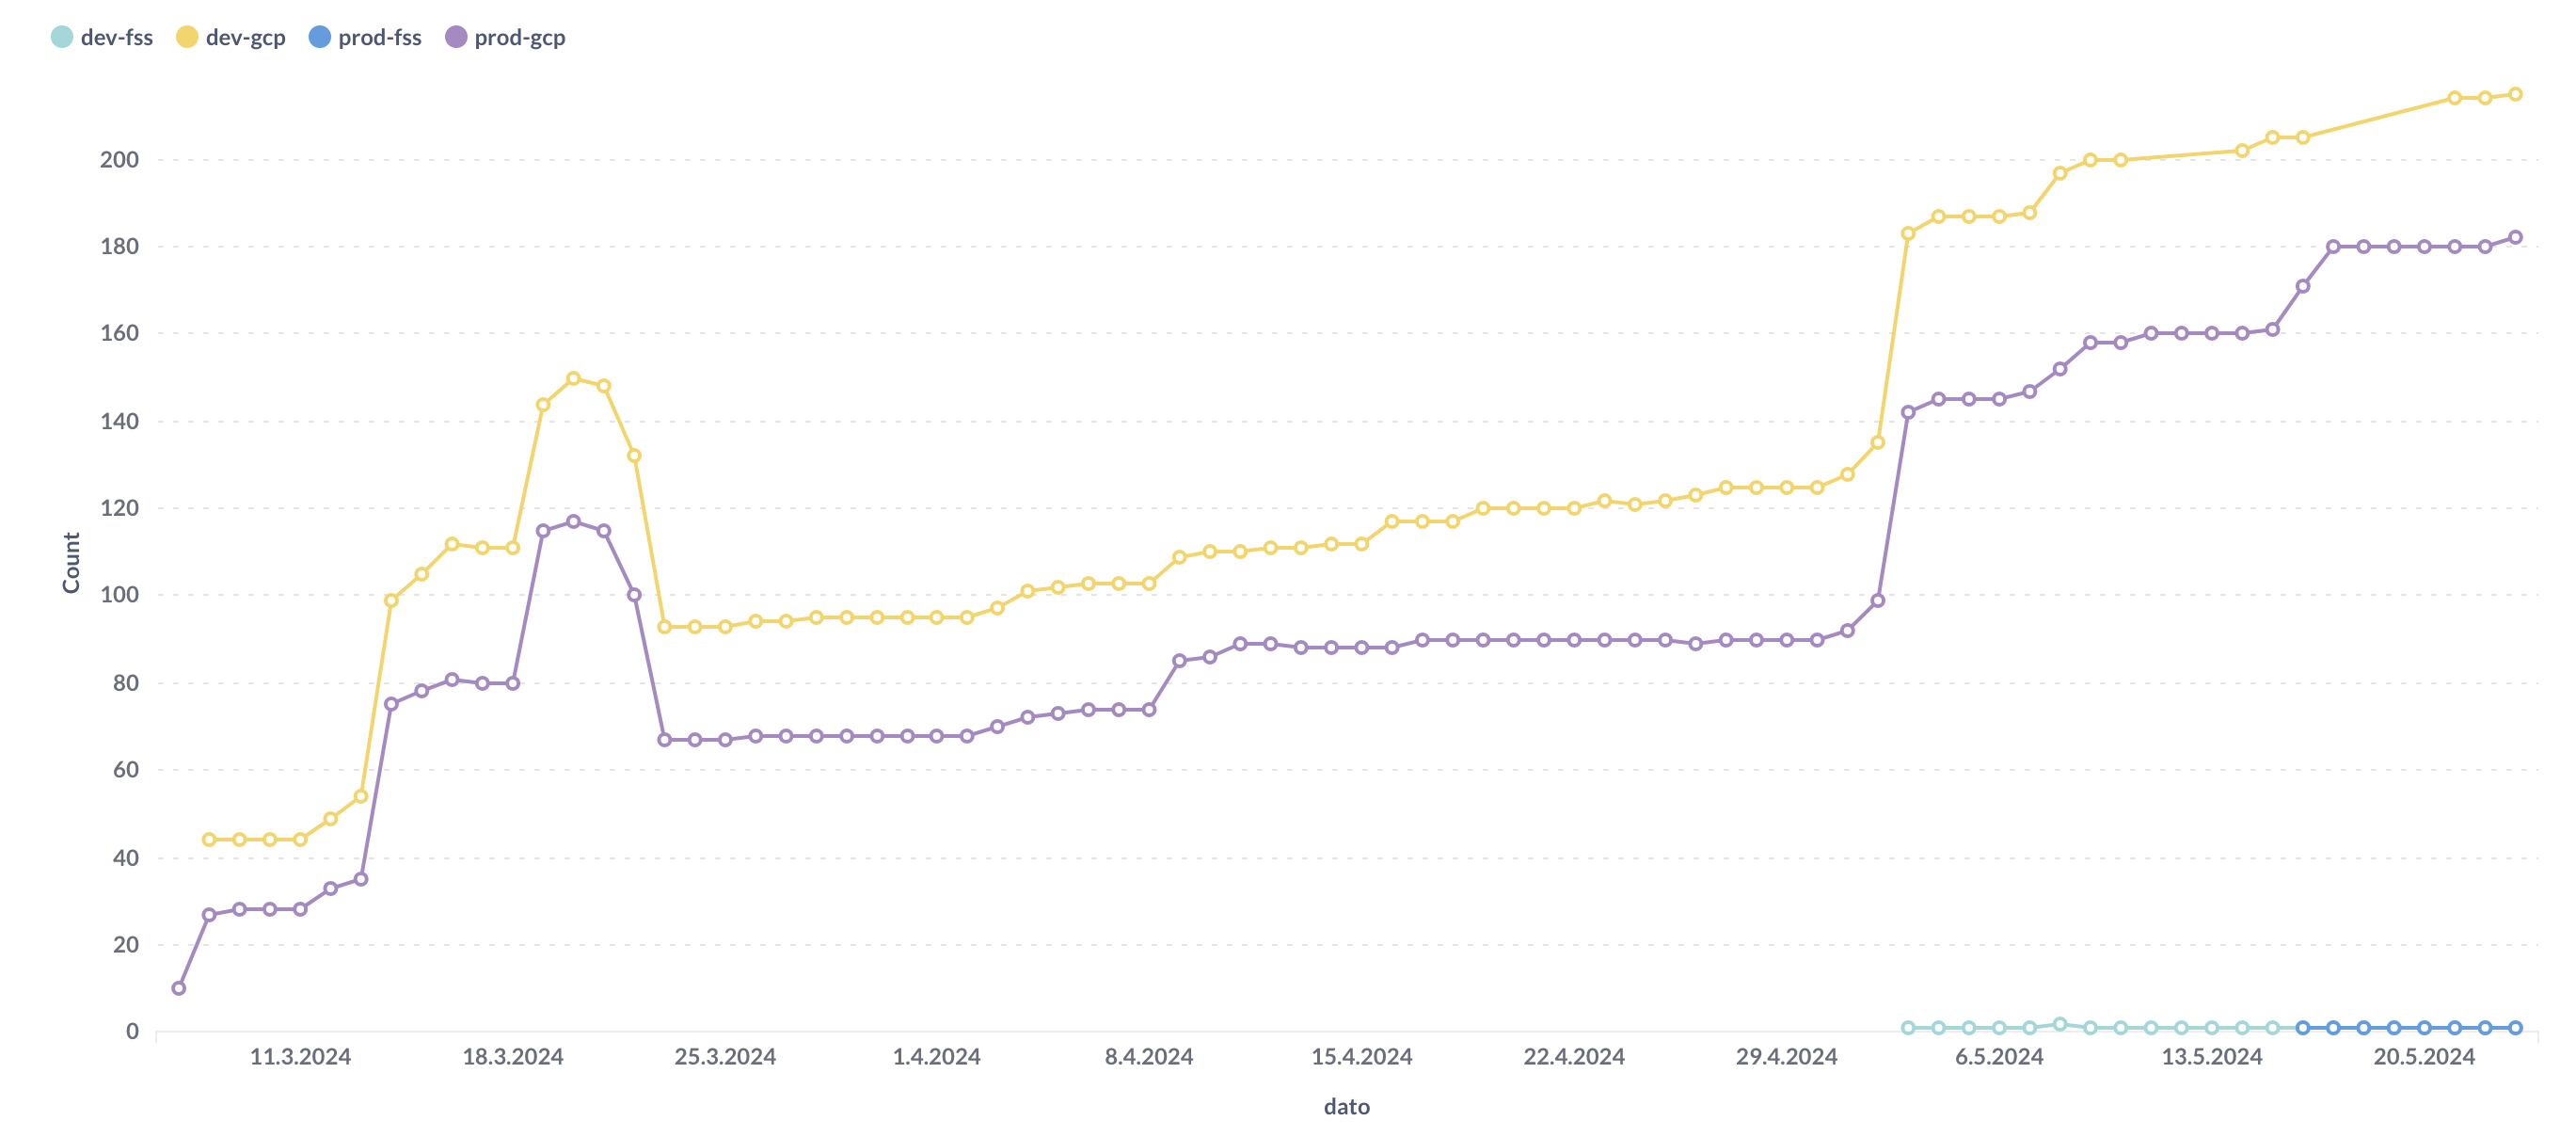
We are super excited about the future of OpenTelemetry at NAV, and we can’t wait to see what use cases the developers will solve using this data! 🚀 As you can see from the graph below, we are generating more traces week by week, and we are confident that this is just the beginning.